Market Outlook
September 12, 2017
Market Cues
Domestic Indices
Chg (%)
(Pts)
(Close)
Indian markets are likely to open positive tracking global indices and SGX Nifty.
BSE Sensex
0.6
195
31,882
The US markets closed with strong gains for the days as the impact of Hurricane
Nifty
0.7
71
10,006
Irma was not as severe as many had anticipated. After a subdued starting trading
activity picked up and financials stocks witnessed strong buying. Further the fear
Mid Cap
0.7
111
15,866
over North Korea issues has gradually subsided and that has come as a big relief
Small Cap
0.8
127
16,452
for major market participants.
Bankex
1.1
313
27,804
The European markets also witnessed relief rally at the start of the new week. Strong
opening in the US markets, reducing geopolitical issues had a similar impact on the
Global Indices
Chg (%)
(Pts)
(Close)
European markets.
Dow Jones
1.2
260
22,057
The Indian markets continued with their upward move and had a strong move on
Nasdaq
1.1
72
6,432
the first day of the week. The GST council increased the cess on the auto industry
marginally and easing geopolitical tension helped market participants taking a
FTSE
0.5
36
7,414
positive call on the markets. Favorable direction from the global markets also
Nikkei
1.4
271
19,546
helped a positive move in the domestic market.
Hang Seng
1.0
287
27,955
Shanghai Com
0.3
11
3,376
News Analysis
InterGlobe Aviation to raise funds via share sales up to `4,000 cr
Advances / Declines
BSE
NSE
Detailed analysis is on Pg2
Advances
1,417
923
Declines
1,262
779
Investor’s Ready Reckoner
Unchanged
172
74
Key Domestic & Global Indicators
Stock Watch: Latest investment recommendations on 150+ stocks
Volumes (` Cr)
Refer Pg7 onwards
BSE
3,814
Top Picks
NSE
25,803
CMP
Target
Upside
Company
Sector
Rating
(`)
(`)
(%)
Blue Star
Capital Goods
Accumulate
792
807
1.9
#Net Inflows (` Cr)
Net
Mtd
Ytd
Dewan Housing FinanceFinancials
Accumulate
548
610
11.3
FII
(127)
(3,536)
43,75
Mahindra Lifespace
Real Estate
Buy
439
522
18.8
MFs
365
2,255
71,14
Navkar Corporation
Others
Buy
194
265
36.7
KEI Industries
Capital Goods
Buy
326
390
19.6
More Top Picks on Pg5
Top Gainers
Price (`)
Chg (%)
Ipcalab
471
11.9
Key Upcoming Events
Previous
Consensus
Ptc
125
7.4
Date
Region
Event Description
Reading
Expectations
Symphony
1,425
6.8
Sep 12, 2017 UK
CPI (YoY)
2.60
2.80
Wabcoindia
5,950
6.3
Sep 12, 2017 India
Industrial Production YoY
(0.10)
1.70
Sep 13, 2017 US
Producer Price Index (mom)
(0.20)
Bajajelec
366
6.0
Sep 13, 2017 UK
Jobless claims change
(4.20)
Sep 14, 2017 US
Initial Jobless claims
298.00
300.00
Top Losers
Price (`)
Chg (%)
More Events on Pg7
Jpassociat
22
(6.4)
Cadilahc
477
(4.9)
Bomdyeing
149
(4.7)
Vakrangee
458
(3.8)
Sreinfra
113
(3.5)
#as on 11th Sep, 2017
Market Outlook
September 12, 2017
News Analysis
InterGlobe Aviation to sell shares to raise upto `4000 cr
InterGlobe Aviation Ltd, which owns the IndiGo airlines has said its board has
approved an institutional share sale of around Rs 4000 cr. The board of the
company has approved the sale of up to 33.57 million shares including fresh
issuance of 22.38 million shares and a secondary share sale of 11.19 million
shares by promoters. The issue is aimed at achieving the minimum public
shareholding of 25%. At the end of 1QFY18 the founders of the company held
a combined 85.85% share of the company, and as per regulatory norm the
company will have to reduce the share holding to 75%. IndiGo has been one
of the fastest airline operator in India and has a market share of ~ 40% in the
domestic airline market.
Economic and Political News
Amby valley auction to go ahead as Supreme court rejects Subrata Roy’s plea
Govt mulls `10 trillion public financing for infrastructure projects
Hiring in India is set to pick up after 3 quarters of decline; Manpower group
says
Corporate News
Supreme Court seeks resolution plan in Jaypee Infratech case within 45 days
Thyssenkrupp says Tata Steel merger deal may come in September
ITC looks to accelerate growth in non cigarette business
Market Outlook
September 12, 2017
Top Picks
Market Cap
CMP
Target
Upside
Company
Rationale
(` Cr)
(`)
(`)
(%)
Strong growth in domestic business due to its leadership
in acute therapeutic segment. Alkem expects to launch
Alkem Laboratories
21,724
1,817
2,161
18.9
more products in USA, which bodes for its international
business.
We expect the company would report strong profitability
Asian Granito
1,347
448
490
9.4
owing to better product mix, higher B2C sales and
amalgamation synergy.
Favorable outlook for the AC industry to augur well for
Cooling products business which is out pacing the
Blue Star
7,584
792
807
1.9
market growth. EMPPAC division's profitability to improve
once operating environment turns around.
With a focus on the low and medium income (LMI)
consumer segment, the company has increased its
Dewan Housing Finance
17,192
548
610
11.3
presence in tier-II & III cities where the growth
opportunity is immense.
Loan growth is likely to pick up after a sluggish FY17.
Karur Vysya Bank
8,865
147
160
9.1
Lower credit cost will help in strong bottom-line growth.
Increasing share of CASA will help in NIM improvement.
High order book execution in EPC segment, rising B2C
KEI Industries
2,537
326
390
19.6
sales and higher exports to boost the revenues and
profitability
Speedier execution and speedier sales, strong revenue
Mahindra Lifespace
2,255
439
522
18.8
visibility in short-to-long run, attractive valuations
Expected to benefit from the lower capex requirement
Music Broadcast
2,202
386
434
12.5
and 15 year long radio broadcast licensing.
Massive capacity expansion along with rail advantage at
Navkar Corporation
2,764
194
265
36.7
ICD as well CFS augurs well for the company
Strong brands and distribution network would boost
Siyaram Silk Mills
2,125
2,267
2,500
10.3
growth going ahead. Stock currently trades at an
inexpensive valuation.
Market leadership in Hindi news genre and no.
2
viewership ranking in English news genre, exit from the
TV Today Network
1,615
271
344
27.0
radio business, and anticipated growth in ad spends by
corporates to benefit the stock.
After GST, the company is expected to see higher
volumes along with improving product mix. The Gujarat
Maruti Suzuki
2,46,044
8,145
8,580
5.3
plant will also enable higher operating leverage which
will be margin accretive.
Source: Company, Angel Research
Market Outlook
September 12, 2017
Key Upcoming Events
Global economic events release calendar
Bl oomberg Data
D ate
Time
C ountry
Event Description
Unit
Period
L ast Reporte d
E stimate d
Sep 12, 2017
2:00 PM UK
CPI (YoY)
% Change
Aug
2.60
2.80
5:30 PM India
Industrial Production YoY
% Change
Jul
(0.10)
1.70
Sep 13, 2017
US
Producer Price Index (mom)
% Change
Aug
(0.20)
2:00 PM UK
Joble ss claims change
% Change
Aug
(4.20)
Sep 14, 2017
6:00 PM US
Initial Jobless claims
Thousands
Sep 9
298.00
300.00
6:00 PM US
Consumer price index (mom)
% Change
Aug
0.10
0.30
7:30 AM China
Industrial Production (YoY)
% Change
Aug
6.40
6.60
12: 00 PM India
Monthly Wholesale Prices YoY%
% Change
Aug
1.88
3.20
4:30 PM UK
BOE Announce s rate s
% Ratio
Sep 14
0.25
0.25
Sep 15, 2017
India
Imports YoY%
% Change
Aug
15.40
India
Exports YoY%
% Change
Aug
3.94
6:45 PM US
Industrial Production
%
Aug
0.19
0.10
Sep 18, 2017
2:30 PM Euro Zone
Euro-Zone CPI (YoY)
%
Aug F
1.50
Sep 19, 2017
6:00 PM US
Housi ng Starts
Thousands
Aug
1,155.00
1,180.00
6:00 PM US
Building permits
Thousands
Aug
1,230.00
1,218.00
Sep 20, 2017
7:30 PM US
Existing home sales
Million
Aug
5.44
5.47
11: 30 PM US
FOMC rate decision
%
Sep 20
1.25
1.25
Sep 21, 2017
1:00 PM Germany
PMI Services
Value
Sep P
53.50
Sep 22, 2017
7:30 PM Euro Zone
Euro-Zone Consumer Confidence
Value
Sep A
(1.50)
1:00 PM Germany
PMI Manufacturing
Value
Sep P
59.30
Sep 26, 2017
7:30 PM US
Consumer Confidence
S.A./ 1985=100
Sep
122.90
7:30 PM US
New home sales
Thousands
Aug
571.00
Sep 28, 2017
6:00 PM US
GDP Qoq (Annualise d)
% Change
2Q T
3.00
Sep 29, 2017
1:25 PM Germany
Unempl oyment change (000's)
Thousands
Sep
(5.00)
2:00 PM UK
GDP (YoY)
% Change
2Q F
1.70
Source: Bloomberg, Angel Research
Market Outlook
September 12, 2017
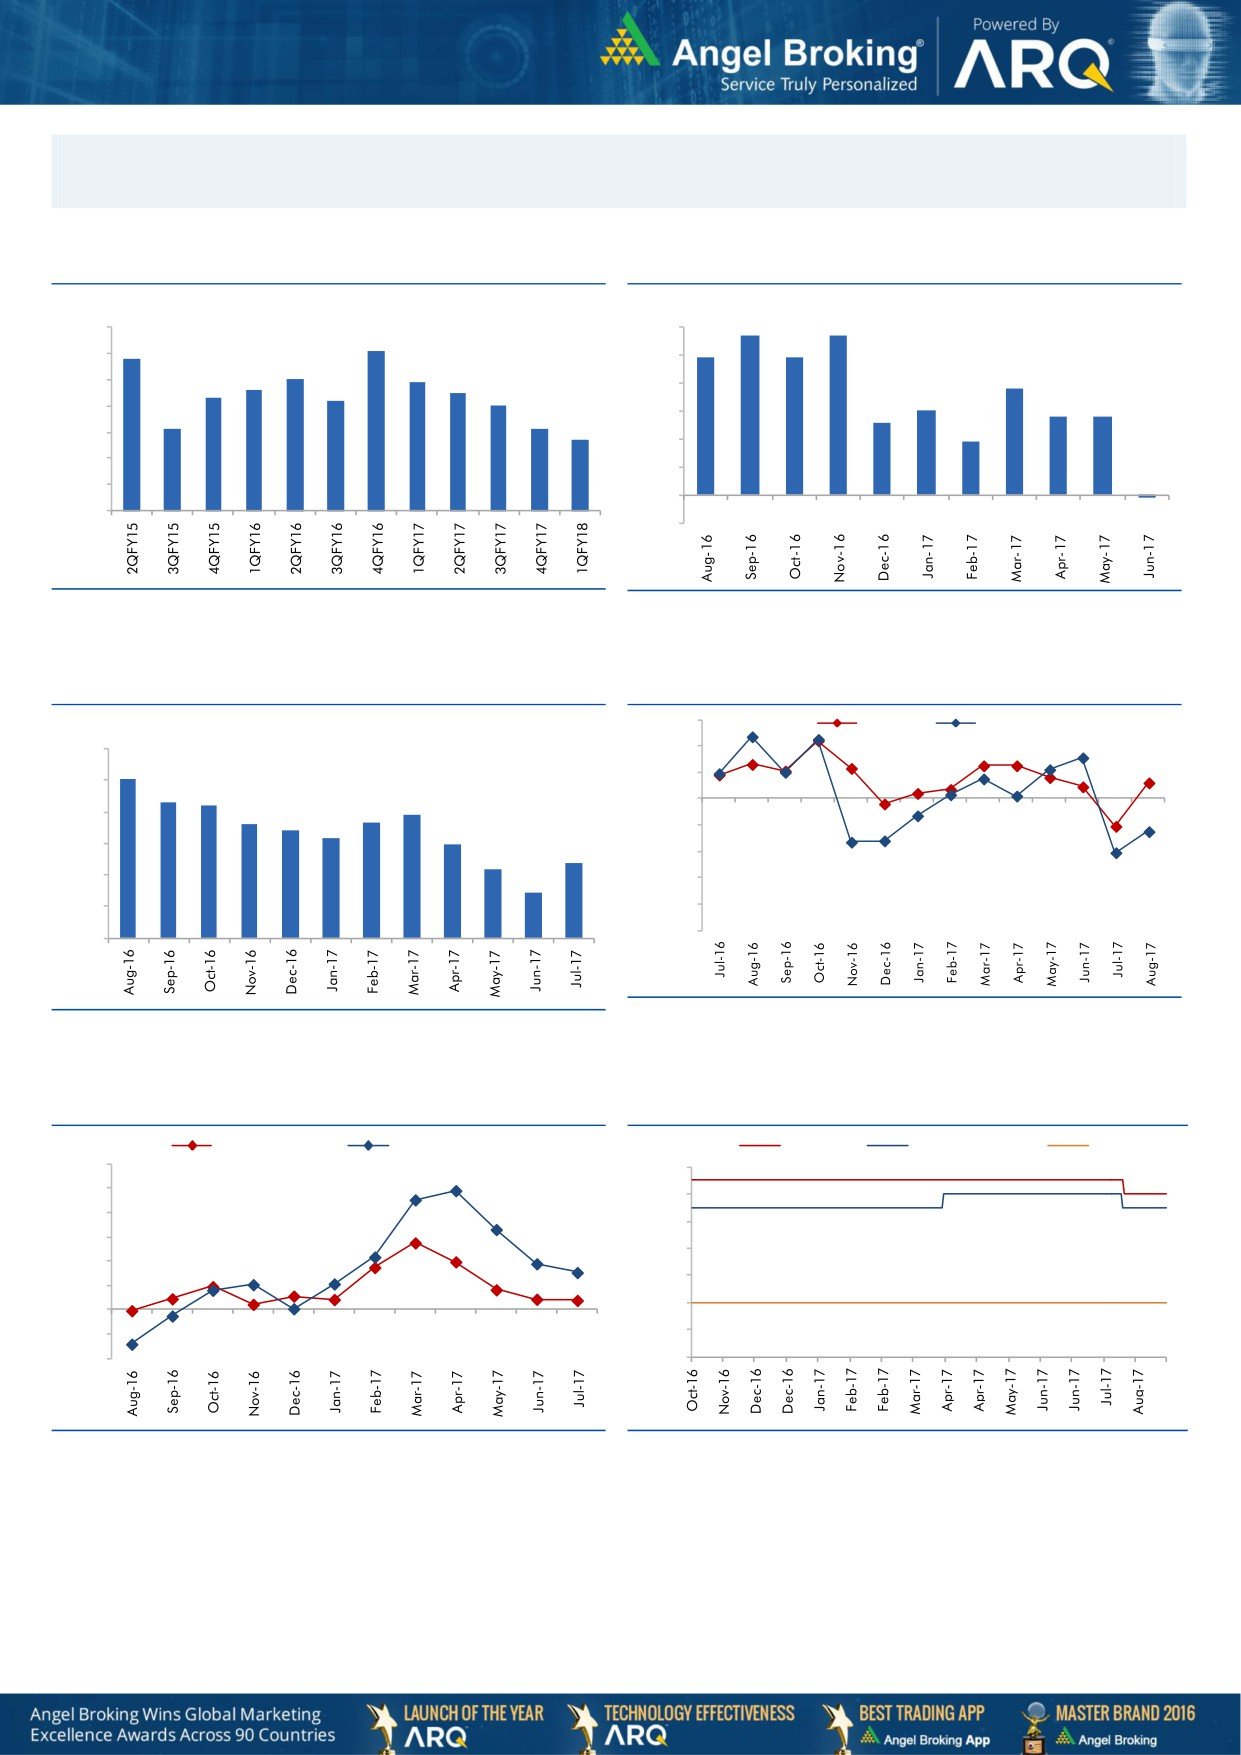
Macro watch
Exhibit 1: Quarterly GDP trends
Exhibit 2: IIP trends
(%)
(%)
5.7
5.7
10.0
6.0
9.1
8.8
4.9
4.9
9.0
5.0
8.0
7.9
7.6
7.5
3.8
8.0
7.3
7.2
4.0
7.0
3.0
2.6
2.8
2.8
7.0
6.1
6.1
3.0
5.7
1.9
6.0
2.0
5.0
1.0
4.0
-
3.0
(0.1)
(1.0)
Source: CSO, Angel Research
Source: MOSPI, Angel Research
Exhibit 3: Monthly CPI inflation trends
Exhibit 4: Manufacturing and services PMI
56.0
Mfg. PMI
Services PMI
(%)
6.0
54.0
5.1
52.0
5.0
4.3
4.2
3.9
50.0
3.6
3.7
4.0
3.4
3.2
3.0
48.0
3.0
2.4
2.2
46.0
2.0
1.5
44.0
1.0
42.0
40.0
-
Source: Market, Angel Research; Note: Level above 50 indicates expansion
Source: MOSPI, Angel Research
Exhibit 5: Exports and imports growth trends
Exhibit 6: Key policy rates
(%)
Exports yoy growth
Imports yoy growth
(%)
Repo rate
Reverse Repo rate
CRR
60.0
6.50
50.0
6.00
40.0
5.50
30.0
5.00
20.0
4.50
10.0
4.00
0.0
(10.0)
3.50
(20.0)
3.00
Source: Bloomberg, Angel Research
Source: RBI, Angel Research
Market Outlook
September 12, 2017
Global watch
Exhibit 1: Latest quarterly GDP Growth (%, yoy) across select developing and developed countries
(%)
8.0
6.9
7.0
5.8
6.0
5.3
5.0
5.0
1.1
3.7
4.0
2.5
3.0
2.2
1.7
1.7
2.0
1.4
0.8
1.0
0.3
-
Source: Bloomberg, Angel Research
Exhibit 2: 2017 GDP Growth projection by IMF (%, yoy) across select developing and developed countries
(%)
7.2
6.6
7.0
6.0
5.1
5.0
4.5
4.0
3.0
3.0
2.3
2.0
1.4
1.6
2.0
1.4
1.2
0.2
0.8
1.0
-
Source: IMF, Angel Research
Exhibit 3: One year forward P-E ratio across select developing and developed countries
(x)
25.0
20.0
15.0
10.0
5.0
-
Source: IMF, Angel Research
Market Outlook
September 12, 2017
Exhibit 4: Relative performance of indices across globe
Returns (%)
C ountry
Name of index
Closing price
1M
3M
1YR
Brazil
Bovespa
73,079
7.6
16.4
22.7
Russia
Micex
2,033
4.2
9.8
1.9
India
Nifty
9,935
0.3
3.7
11.9
China
Shanghai Composite
3,365
3.5
7.1
9.8
South Africa
Top 40
49,274
0.6
8.1
6.5
Mexico
Mexbol
50,084
(2.3)
1.9
7.8
Indonesia
LQ45
976
1.0
2.1
3.8
Malaysia
KLCI
1,780
0.3
0.2
5.8
Thailand
SET 50
1,046
4.8
5.7
10.3
USA
Dow Jones
21,798
(1.3)
2.9
20.5
UK
FTSE
7,378
(2.2)
(2.0)
10.1
Japan
Nikkei
19,275
(3.6)
(3.2)
13.9
Germany
DAX
12,304
3.5
(2.6)
19.2
France
CAC
5,113
1.1
(1.7)
17.7
Source: Bloomberg, Angel Research
Stock Watch
September 12, 2017
Company Name
Reco
CMP
Target
Mkt Cap
Sales ( Čcr )
OPM(%)
EPS (Č)
PER(x)
P/BV(x)
RoE(%)
EV/Sales(x)
(Č)
Price ( Č)
( Č cr )
FY18E FY19E
FY18E
FY19E
FY18E
FY19E
FY18E
FY19E
FY18E
FY19E
FY18E
FY19E
FY18E
FY19E
Agri / Agri Chemical
Rallis
Reduce
222
209
4,308
1,873
2,099
15.0
15.0
9.5
10.5
23.3
21.1
3.5
3.2
15.8
16.0
2.2
2.0
United Phosphorus
Neutral
812
-
41,248
18,922
21,949
18.0
18.5
36.2
45.6
22.4
17.8
4.7
3.9
22.7
23.8
2.3
2.0
Auto & Auto Ancillary
Ashok Leyland
Accumulate
116
127
34,036
23,339
27,240
10.1
10.8
4.7
6.2
25.0
18.7
5.0
4.4
20.0
23.6
1.4
1.2
Bajaj Auto
Accumulate
2,930
3,151
84,793
23,936
27,955
19.5
20.1
142.7
167.3
20.5
17.5
4.5
4.0
21.8
22.8
3.1
2.6
Bharat Forge
Neutral
1,178
-
27,413
7,637
8,755
21.7
23.2
36.1
47.3
32.6
24.9
5.9
5.0
18.5
20.8
3.4
2.9
Eicher Motors
Neutral
32,467
-
88,383
19,043
22,837
19.5
19.9
835.4
1,019.0
38.9
31.9
14.5
11.2
40.9
37.8
4.5
3.7
Gabriel India
Neutral
209
-
3,003
1,782
2,033
9.7
10.2
7.1
8.9
29.4
23.6
5.9
5.0
21.0
22.2
1.6
1.4
Hero Motocorp
Neutral
3,946
-
78,797
32,239
36,878
16.0
15.6
184.4
206.5
21.4
19.1
6.7
5.9
31.3
30.7
2.2
1.9
Jamna Auto Industries Neutral
252
-
2,009
1,441
1,662
14.4
14.8
13.9
17.6
18.1
14.3
5.0
4.0
30.0
31.0
1.4
1.2
Mahindra and Mahindra Neutral
1,281
-
79,531
46,971
53,816
13.6
14.0
67.7
79.8
18.9
16.1
2.7
2.4
15.0
15.9
1.6
1.3
Maruti
Neutral
8,145
-
246,044
81,825
101,245
15.0
15.0
283.5
356.0
28.7
22.9
6.3
5.1
21.9
22.4
2.7
2.1
Minda Industries
Neutral
885
-
7,649
4,328
5,084
11.0
11.9
27.3
36.4
32.5
24.3
6.9
5.4
23.1
25.6
1.8
1.6
Motherson Sumi
Neutral
333
-
70,071
55,937
64,445
10.8
11.4
16.9
21.1
19.7
15.8
4.4
4.5
25.2
25.4
1.3
1.1
Tata Motors
Neutral
375
-
108,391
303,167
343,649
11.8
13.8
33.1
54.7
11.3
6.9
1.9
1.5
16.9
23.0
0.4
0.3
TVS Motor
Neutral
639
-
30,372
13,992
16,216
9.0
9.4
17.1
20.3
37.5
31.5
10.0
7.7
29.7
27.7
2.1
1.8
Amara Raja Batteries
Accumulate
785
858
13,402
6,140
7,122
14.3
15.6
29.3
39.0
26.8
20.1
4.6
3.8
17.1
19.0
2.2
1.9
Exide Industries
Neutral
221
-
18,819
8,689
9,854
15.1
15.2
9.7
11.0
22.9
20.1
4.1
3.6
15.7
16.1
1.9
1.7
Apollo Tyres
Neutral
256
-
13,046
15,739
17,326
13.3
14.6
20.4
26.7
12.6
9.6
1.5
1.3
20.4
26.7
1.1
1.0
Ceat
Neutral
1,751
-
7,083
6,661
7,717
11.1
14.2
116.2
178.2
15.1
9.8
2.6
2.2
15.2
21.3
1.2
1.0
JK Tyres
Neutral
148
-
3,346
8,318
9,239
16.2
16.4
21.0
27.5
7.0
5.4
1.4
1.1
19.1
20.4
0.9
0.7
Swaraj Engines
Neutral
1,996
-
2,479
788
889
16.4
16.5
71.6
81.0
27.9
24.7
8.0
7.5
29.6
31.0
2.8
2.4
Subros
Neutral
244
-
1,461
1,855
2,135
11.6
11.8
10.3
14.7
23.8
16.6
3.6
3.1
15.8
19.1
1.0
0.9
Capital Goods
BEML
Neutral
1,869
-
7,782
4,286
5,194
7.1
8.2
42.9
58.1
43.6
32.2
3.6
3.2
7.6
8.7
1.9
1.5
Bharat Electronics
Neutral
192
-
42,841
10,258
12,470
19.6
19.5
7.3
8.6
26.3
22.3
0.5
0.5
20.4
21.9
3.7
3.0
Voltas
Neutral
535
-
17,709
6,778
8,004
9.6
11.0
17.1
22.4
31.3
23.9
7.5
6.5
17.7
19.8
2.3
1.9
BHEL
Neutral
131
-
31,953
33,200
39,167
6.8
9.5
6.2
11.2
21.1
11.7
1.0
0.9
4.6
8.0
0.5
0.4
Blue Star
Neutral
792
-
7,584
5,101
5,997
6.0
7.0
17.9
26.6
44.3
29.8
9.4
8.6
21.9
29.0
1.5
1.3
CG Power and Industrial
Neutral
87
-
5,462
6,555
7,292
7.5
7.5
-
0.8
8,715.0
108.9
1.4
1.4
0.1
1.2
0.9
0.8
Solutions
Greaves Cotton
Neutral
148
-
3,620
1,778
1,993
14.7
15.1
8.1
9.1
18.3
16.3
4.1
3.8
21.8
23.6
1.8
1.6
Stock Watch
September 12, 2017
Company Name
Reco
CMP
Target
Mkt Cap
Sales ( Čcr )
OPM(%)
EPS (Č)
PER(x)
P/BV(x)
RoE(%)
EV/Sales(x)
(Č)
Price ( Č)
( Č cr )
FY18E FY19E
FY18E
FY19E
FY18E
FY19E
FY18E
FY19E
FY18E
FY19E
FY18E
FY19E
FY18E
FY19E
Capital Goods
KEC International
Neutral
315
-
8,109
9,779
11,113
9.4
9.8
14.2
18.2
22.2
17.3
4.3
3.5
21.1
22.1
1.1
1.0
KEI Industries
Neutral
326
-
2,537
3,001
3,391
10.0
10.0
13.0
16.1
25.1
20.2
4.6
3.8
18.2
18.7
1.0
0.9
Thermax
Neutral
880
-
10,480
4,125
4,747
10.3
10.8
26.7
31.5
32.9
27.9
3.7
3.4
11.2
12.0
2.3
2.0
VATech Wabag
Accumulate
616
681
3,365
3,867
4,126
9.6
10.0
34.9
39.8
17.7
15.5
2.9
2.5
17.7
17.5
0.9
0.8
Cement
ACC
Neutral
1,796
-
33,733
12,255
13,350
13.5
14.3
58.0
66.2
31.0
27.1
3.7
3.4
11.5
12.2
2.7
2.5
Ambuja Cements
Neutral
285
-
56,611
10,250
11,450
17.5
19.0
7.2
8.3
39.6
34.4
2.8
2.7
7.0
7.8
5.3
4.7
India Cements
Neutral
185
-
5,693
6,135
6,750
14.8
15.2
8.5
11.5
21.7
16.1
1.1
1.0
4.8
6.2
1.3
1.1
JK Cement
Neutral
1,024
-
7,157
4,150
4,775
19.2
20.0
49.0
63.5
20.9
16.1
3.3
2.8
17.0
18.5
2.2
1.8
J K Lakshmi Cement
Neutral
419
-
4,930
3,422
3,757
15.5
17.0
13.5
23.2
31.0
18.1
3.2
2.8
10.8
15.5
1.8
1.6
Orient Cement
Neutral
163
-
3,335
2,215
3,233
16.8
17.0
5.9
6.9
27.6
23.6
2.1
2.0
10.8
10.1
2.5
1.7
UltraTech Cement
Neutral
4,166
-
114,360
28,250
35,150
20.2
23.5
77.5
122.2
53.8
34.1
4.5
4.1
9.6
14.8
4.5
3.6
Construction
KNR Constructions
Neutral
201
-
2,821
1,846
2,203
14.5
14.5
12.1
13.7
16.6
14.7
0.9
0.8
17.5
16.7
1.6
1.3
Larsen & Toubro
Neutral
1,217
-
170,432
95,787
109,476
10.2
11.6
44.5
50.8
27.4
24.0
3.4
3.2
12.9
13.1
2.3
2.1
Gujarat Pipavav Port
Neutral
141
-
6,821
739
842
61.6
62.7
5.1
6.2
27.7
22.9
3.5
3.4
12.7
14.9
8.7
7.5
PNC Infratech
Accumulate
134
143
3,429
2,040
2,935
13.0
13.0
6.4
9.0
20.9
14.9
0.5
0.5
9.7
12.2
1.7
1.2
Simplex Infra
Neutral
437
-
2,164
6,012
6,619
11.6
11.7
21.1
31.0
20.8
14.1
1.4
1.3
6.5
8.6
0.9
0.8
Sadbhav Engineering
Neutral
284
-
4,880
3,823
4,426
10.7
10.8
10.3
11.8
27.6
24.1
3.3
2.9
10.1
10.5
1.6
1.4
NBCC
Neutral
208
-
18,761
9,099
12,706
6.4
6.4
7.3
9.6
28.6
21.8
1.3
1.0
27.5
30.5
1.9
1.4
MEP Infra
Neutral
104
-
1,697
2,403
2,910
18.3
16.8
2.4
6.1
44.4
17.2
16.8
11.4
35.2
55.8
1.9
1.5
SIPL
Neutral
99
-
3,473
2,060
2,390
46.8
47.7
(5.8)
(3.1)
3.7
4.2
(14.2)
(2.3)
6.4
6.0
Engineers India
Neutral
159
-
10,701
1,795
2,611
21.1
22.4
5.9
8.1
26.9
19.6
1.9
1.9
12.9
16.1
4.3
2.8
Financials
Axis Bank
Buy
493
580
118,249
32,558
35,843
3.5
3.2
27.8
41.0
17.7
12.0
1.9
1.7
11.4
14.9
-
-
Bank of Baroda
Neutral
138
-
31,705
22,533
26,079
2.4
2.4
12.0
20.9
11.5
6.6
0.7
0.7
6.6
11.0
-
-
Canara Bank
Neutral
334
-
19,941
17,925
20,235
2.0
2.1
18.5
36.5
18.1
9.2
0.7
0.6
3.4
6.2
-
-
Can Fin Homes
Neutral
2,842
-
7,565
586
741
3.5
3.5
107.8
141.0
26.4
20.2
5.8
4.7
24.1
25.6
-
-
Cholamandalam Inv. &
Neutral
1,178
-
18,405
2,826
3,307
6.3
6.3
53.7
64.6
22.0
18.2
3.7
3.2
18.3
18.9
-
-
Fin. Co.
Dewan Housing Finance Accumulate
548
610
17,192
2,676
3,383
2.4
2.7
37.4
49.7
14.7
11.0
1.9
1.7
13.8
16.2
-
-
Equitas Holdings
Buy
172
235
5,832
1,125
1,380
9.6
9.8
1.5
6.0
114.8
28.7
2.6
2.4
2.4
8.2
-
-
Federal Bank
Accumulate
113
125
21,947
4,896
5,930
2.8
3.1
5.4
7.6
21.0
14.9
1.8
1.6
8.5
11.0
-
-
Stock Watch
September 12, 2017
Company Name
Reco
CMP
Target
Mkt Cap
Sales ( Čcr )
OPM(%)
EPS (Č)
PER(x)
P/BV(x)
RoE(%)
EV/Sales(x)
(Č)
Price ( Č)
( Č cr )
FY18E FY19E
FY18E
FY19E
FY18E
FY19E
FY18E
FY19E
FY18E
FY19E
FY18E
FY19E
FY18E
FY19E
Financials
HDFC Bank
Neutral
1,823
-
470,562
55,236
63,253
4.5
4.4
68.9
82.4
26.5
22.1
4.6
3.8
18.7
18.5
-
-
ICICI Bank
Accumulate
291
315
186,685
42,361
51,378
3.6
3.9
18.4
25.7
15.8
11.3
1.7
1.7
11.3
15.0
-
-
Karur Vysya Bank
Accumulate
147
160
8,865
3,289
3,630
3.7
3.9
10.8
14.1
13.5
10.4
1.6
1.5
12.5
14.7
-
-
LIC Housing Finance
Neutral
656
-
33,103
4,895
6,332
3.4
3.7
50.7
66.8
12.9
9.8
2.6
2.1
21.7
23.8
-
-
Punjab Natl.Bank
Neutral
138
-
29,409
23,708
25,758
2.1
2.1
5.9
16.4
23.5
8.4
0.7
0.7
3.0
8.3
-
-
RBL Bank
Neutral
536
-
20,321
2,309
2,888
2.6
2.5
16.4
19.1
32.7
28.1
4.1
3.7
13.3
13.8
-
-
Repco Home Finance
Buy
670
825
4,192
496
597
4.4
4.2
38.5
48.7
17.4
13.8
3.1
2.6
19.6
20.6
-
-
South Ind.Bank
Neutral
29
-
5,215
3,195
3,567
3.0
3.1
3.0
3.8
9.6
7.5
1.0
0.9
10.5
11.9
-
-
St Bk of India
Neutral
271
-
233,799
105,827
121,056
2.4
2.5
16.1
25.6
16.8
10.6
1.3
1.2
6.6
9.9
-
-
Union Bank
Neutral
133
-
9,672
14,650
16,225
2.3
2.3
23.1
32.5
5.8
4.1
0.4
0.4
7.1
9.2
-
-
Yes Bank
Neutral
1,842
-
84,314
11,088
13,138
3.0
2.9
84.0
99.3
21.9
18.5
3.4
2.9
16.3
16.8
-
-
FMCG
Akzo Nobel India
Neutral
1,824
-
8,748
3,164
3,607
13.8
13.7
58.6
67.9
31.1
26.9
7.6
6.7
24.5
25.1
2.6
2.3
Asian Paints
Neutral
1,237
-
118,638
17,603
20,615
18.6
18.6
2,128.9
2,543.3
0.6
0.5
12.3
10.3
28.0
28.9
6.5
5.5
Britannia
Neutral
4,299
-
51,619
9,690
11,278
14.8
15.4
84.0
101.0
51.2
42.6
18.7
14.8
40.6
39.0
5.3
4.5
Colgate
Neutral
1,149
-
31,250
4,420
5,074
24.9
25.3
28.6
32.8
40.2
35.0
15.9
12.8
43.8
40.5
6.8
5.9
Dabur India
Neutral
310
-
54,598
8,346
9,344
19.6
19.9
7.8
9.0
39.7
34.4
8.0
7.2
25.2
24.8
6.1
5.4
GlaxoSmith Con*
Neutral
5,106
-
21,473
5,072
5,760
18.2
18.4
176.3
199.2
29.0
25.6
6.1
5.6
21.2
21.7
3.6
3.1
Godrej Consumer
Neutral
929
-
63,323
10,171
11,682
20.8
21.5
21.7
27.1
42.8
34.3
9.6
8.3
22.3
23.4
6.3
5.5
HUL
Neutral
1,219
-
263,861
37,077
41,508
20.3
21.8
5,189.9
6,318.5
0.2
0.2
37.2
31.8
74.8
82.0
7.0
6.2
ITC
Neutral
274
-
333,497
44,588
49,853
37.0
37.3
9.6
11.0
28.5
24.9
7.0
6.7
25.1
27.3
7.0
6.2
Marico
Neutral
324
-
41,798
6,788
7,766
18.5
19.2
7.1
8.5
45.6
38.1
16.0
13.7
36.9
38.0
6.0
5.2
Nestle*
Neutral
7,294
-
70,322
10,083
11,182
20.0
20.9
119.7
141.3
60.9
51.6
214.8
196.3
36.7
39.8
6.7
5.9
Tata Global
Neutral
209
-
13,206
7,121
7,641
11.9
12.3
6.9
8.0
30.3
26.2
2.0
1.9
6.8
7.2
1.7
1.5
Procter & Gamble
Neutral
8,327
-
27,029
3,034
3,579
27.1
27.7
167.7
198.8
49.7
41.9
13.3
11.5
28.8
29.5
8.3
7.0
Hygiene
IT
HCL Tech^
Buy
861
1,014
122,906
52,342
57,053
20.9
20.9
62.8
67.6
13.7
12.7
3.1
2.6
22.4
20.6
2.0
1.7
Infosys
Buy
879
1,179
201,800
73,963
80,619
26.0
26.0
64.4
69.3
13.6
12.7
2.7
2.5
19.7
19.6
2.2
1.9
TCS
Accumulate
2,464
2,651
485,425
127,403
138,870
27.6
27.6
144.5
156.0
17.1
15.8
5.1
4.7
29.7
29.8
3.5
3.1
Tech Mahindra
Buy
440
533
42,964
31,015
33,496
15.0
15.0
35.6
38.1
12.4
11.6
2.1
2.0
17.0
16.3
1.2
1.0
Wipro
Neutral
301
-
146,609
58,536
61,858
20.3
20.3
18.2
19.1
16.6
15.8
2.6
2.2
14.6
13.4
2.4
2.3
Stock Watch
September 12, 2017
Company Name
Reco
CMP
Target
Mkt Cap
Sales ( Čcr )
OPM(%)
EPS (Č)
PER(x)
P/BV(x)
RoE(%)
EV/Sales(x)
(Č)
Price ( Č)
( Č cr )
FY18E FY19E
FY18E
FY19E
FY18E
FY19E
FY18E
FY19E
FY18E
FY19E
FY18E
FY19E
FY18E
FY19E
Media
D B Corp
Neutral
376
-
6,913
2,404
2,625
30.5
31.5
23.7
26.9
15.9
14.0
3.7
3.2
23.5
22.8
2.7
2.5
HT Media
Neutral
101
-
2,347
2,589
2,830
15.1
15.4
8.3
10.9
12.2
9.3
1.0
0.9
8.4
10.4
0.5
0.3
Jagran Prakashan
Buy
177
225
5,778
2,541
2,835
28.5
28.7
12.7
14.1
13.9
12.5
2.9
2.5
21.3
21.4
2.1
1.8
Sun TV Network
Neutral
828
-
32,642
3,238
3,789
51.9
55.1
30.9
38.0
26.8
21.8
7.6
6.7
30.0
31.0
9.6
8.1
Hindustan Media
Neutral
263
-
1,927
1,002
1,074
23.3
23.5
29.2
33.8
9.0
7.8
1.4
1.2
15.6
15.4
0.9
0.7
Ventures
TV Today Network
Buy
271
344
1,615
667
727
27.7
27.7
18.6
20.1
14.6
13.5
2.3
2.3
15.6
17.3
2.0
1.8
Music Broadcast Limited Accumulate
386
434
2,202
271
317
91.0
109.0
6.0
10.0
64.3
38.6
4.0
3.6
6.5
9.3
7.7
6.4
Metals & Mining
Coal India
Neutral
257
-
159,499
82,301
91,235
17.0
18.0
17.1
20.5
15.0
12.5
2.8
2.7
45.0
55.0
1.6
1.4
Hind. Zinc
Neutral
309
-
130,393
22,108
24,555
57.0
58.0
22.1
26.3
14.0
11.7
4.5
3.7
32.0
35.0
4.9
4.1
Hindalco
Neutral
250
-
56,079
102,350
105,355
13.5
14.5
21.5
24.5
11.6
10.2
1.6
1.4
15.0
15.2
1.1
1.1
JSW Steel
Neutral
266
-
64,298
64,500
68,245
21.1
21.5
20.1
21.2
13.2
12.6
2.4
2.1
-
-
1.7
1.7
NMDC
Neutral
135
-
42,697
10,209
11,450
47.0
48.0
11.1
12.1
12.2
11.2
1.7
1.6
-
-
3.7
3.3
SAIL
Neutral
63
-
26,061
54,100
63,555
3.0
10.0
(10.0)
1.5
42.1
0.8
0.8
-
-
1.5
1.3
Vedanta
Neutral
330
-
122,556
81,206
87,345
28.0
29.0
26.5
33.5
12.4
9.8
2.8
2.4
-
-
2.3
1.9
Tata Steel
Neutral
661
-
64,227
121,445
126,500
16.2
17.2
65.4
81.3
10.1
8.1
1.6
1.4
-
-
1.1
0.9
Oil & Gas
GAIL
Neutral
394
-
66,697
53,115
52,344
14.2
15.3
30.0
31.1
13.2
12.7
1.6
1.5
-
-
1.0
1.0
ONGC
Neutral
163
-
209,695
83,111
84,934
44.2
44.9
16.4
16.9
10.0
9.7
1.2
1.1
-
-
2.4
2.4
Indian Oil Corp
Neutral
429
-
208,343
396,116
432,560
8.5
8.8
40.1
42.2
10.7
10.2
1.9
1.7
-
-
0.7
0.6
Reliance Industries
Neutral
818
-
532,076
257,711
267,438
17.0
18.2
89.1
89.5
9.2
9.1
0.9
0.8
-
-
1.7
1.6
Pharmaceuticals
Alembic Pharma
Buy
501
600
9,435
3,903
4,584
18.2
19.2
21.8
27.2
23.0
18.4
4.2
3.5
19.8
20.6
2.4
2.1
Alkem Laboratories Ltd
Buy
1,817
2,161
21,724
6,901
7,850
18.4
19.1
85.0
100.5
21.4
18.1
4.3
3.6
20.2
20.1
3.1
2.7
Aurobindo Pharma
Accumulate
741
823
43,417
17,086
19,478
22.1
22.0
44.7
51.4
16.6
14.4
3.7
3.0
24.7
22.7
2.7
2.3
Aventis*
Neutral
4,006
-
9,226
2,508
2,862
16.8
16.8
139.9
153.8
28.6
26.1
4.2
3.4
23.5
25.8
3.3
2.7
Cadila Healthcare
Reduce
477
426
48,858
11,584
13,228
20.3
20.4
18.7
21.3
25.5
22.4
5.7
4.7
24.6
22.9
4.0
3.5
Cipla
Sell
552
458
44,407
16,619
19,437
15.4
16.2
19.7
24.3
28.0
22.7
3.2
2.8
12.0
13.2
2.8
2.4
Dr Reddy's
Neutral
2,159
-
35,799
15,844
17,973
17.6
18.2
91.7
111.0
23.6
19.5
2.7
2.4
11.9
13.0
2.5
2.2
GSK Pharma*
Neutral
2,434
-
20,618
3,260
3,651
15.0
18.0
46.1
58.6
52.8
41.5
10.8
11.2
20.0
26.5
6.2
5.7
Indoco Remedies
Sell
195
153
1,798
1,154
1,310
14.9
14.9
11.3
12.7
17.3
15.4
2.5
2.2
15.0
15.0
1.7
1.4
Ipca labs
Accumulate
471
540
5,941
3,593
4,022
14.5
15.5
19.4
25.2
24.3
18.7
2.2
2.0
9.5
11.2
1.7
1.5
Stock Watch
September 12, 2017
Company Name
Reco
CMP
Target
Mkt Cap
Sales ( Čcr )
OPM(%)
EPS (Č)
PER(x)
P/BV(x)
RoE(%)
EV/Sales(x)
(Č)
Price ( Č)
( Č cr )
FY18E FY19E
FY18E
FY19E
FY18E
FY19E
FY18E
FY19E
FY18E
FY19E
FY18E
FY19E
FY18E
FY19E
Pharmaceuticals
Lupin
Buy
978
1,467
44,170
18,657
21,289
21.3
23.3
52.8
66.7
18.5
14.7
2.8
2.4
16.3
17.5
2.4
2.0
Natco Pharma
Accumulate
735
796
12,804
1,836
1,946
31.8
28.9
22.1
20.6
33.2
35.6
6.7
6.0
20.1
16.7
6.8
6.4
Sun Pharma
Buy
469
558
112,441
32,899
36,451
26.9
25.4
31.6
32.3
14.8
14.5
2.6
2.3
18.7
18.8
3.0
2.6
Syngene International
Buy
476
557
9,524
1,402
1,823
32.8
36.0
15.9
20.7
30.0
23.1
5.6
4.6
18.7
20.0
6.8
5.2
Power
Tata Power
Neutral
81
-
21,800
32,547
33,806
20.5
20.5
4.7
5.4
17.2
15.1
1.6
1.4
10.5
10.5
1.7
1.6
NTPC
Neutral
170
-
140,503
86,070
101,246
28.3
30.7
12.9
16.2
13.2
10.5
1.4
1.3
10.6
12.4
3.0
2.7
Power Grid
Neutral
216
-
112,741
29,183
32,946
89.7
90.0
18.0
20.8
12.0
10.4
2.0
1.8
17.7
18.2
7.8
7.2
Real Estate
Prestige Estate
Neutral
258
-
9,660
4,607
5,146
21.0
22.2
7.9
9.8
32.6
26.3
2.0
1.9
10.3
12.0
3.3
3.0
MLIFE
Buy
439
522
2,255
487
590
12.3
17.8
21.0
31.2
20.9
14.1
1.1
1.0
5.2
7.4
3.3
2.7
Telecom
Bharti Airtel
Neutral
402
-
160,656
97,903
105,233
36.0
36.3
9.3
11.1
43.2
36.4
2.1
2.0
5.0
5.6
2.6
2.3
Idea Cellular
Neutral
79
-
28,368
35,012
37,689
27.1
27.7
(4.4)
(2.7)
1.2
1.3
(6.8)
(4.6)
2.1
1.9
zOthers
Abbott India
Neutral
4,153
-
8,824
3,244
3,723
14.9
16.1
167.5
209.4
24.8
19.8
5.5
4.6
23.7
24.8
2.4
2.0
Asian Granito
Accumulate
448
490
1,347
1,169
1,286
12.5
12.5
16.0
19.7
28.0
22.7
3.0
2.6
10.7
11.6
1.4
1.2
Bajaj Electricals
Accumulate
366
395
3,719
4,646
5,301
6.7
7.6
16.1
22.3
22.8
16.4
3.7
3.2
16.4
19.2
0.8
0.7
Banco Products (India)
Neutral
218
-
1,562
1,530
1,695
13.2
12.7
19.0
20.0
11.5
10.9
1.8
1.6
0.2
0.2
0.9
103.4
Coffee Day Enterprises
Neutral
246
-
5,069
3,494
3,913
17.4
18.0
4.8
5.7
-
43.2
2.2
2.1
-
0.1
1.9
1.7
Ltd
Elecon Engineering
Neutral
52
-
580
171
201
15.0
16.2
36.0
43.0
1.4
1.2
0.1
0.1
0.1
0.1
2.8
2.3
Garware Wall Ropes
Neutral
910
-
1,991
928
1,003
15.2
15.2
39.4
43.2
23.1
21.1
3.8
3.3
16.5
15.4
2.0
1.8
Goodyear India*
Neutral
820
-
1,891
1,717
1,866
11.8
12.3
47.9
49.8
17.1
16.5
2.6
2.3
15.6
15.7
0.8
114.1
Hitachi
Neutral
1,910
-
5,193
2,355
2,715
10.3
10.8
49.0
60.9
39.0
31.4
9.1
7.2
0.2
0.2
2.2
1.9
HSIL
Neutral
382
-
2,763
2,240
2,670
14.6
15.0
17.0
22.0
22.5
17.4
1.9
1.8
0.1
0.1
1.5
1.2
Interglobe Aviation
Neutral
1,216
-
43,979
22,570
27,955
14.2
15.0
63.6
81.8
19.1
14.9
10.1
8.5
0.5
0.6
1.6
1.2
Jyothy Laboratories
Neutral
415
-
7,545
1,781
2,044
14.1
15.0
9.4
10.5
44.4
39.6
9.5
8.9
0.2
0.2
4.5
3.8
Linc Pen & Plastics
Neutral
235
-
347
420
462
9.3
9.3
15.3
17.1
15.4
13.7
2.6
2.7
16.9
19.5
0.9
0.8
M M Forgings
Neutral
623
-
752
542
642
20.1
21.0
41.6
56.8
15.0
11.0
2.1
1.8
0.1
0.2
1.8
1.6
Mirza International
Neutral
176
-
2,114
1,148
1,285
18.0
18.0
8.0
9.4
21.9
18.8
3.6
3.1
16.3
16.1
2.0
1.7
Navkar Corporation
Buy
194
265
2,764
561
617
41.5
41.5
11.5
12.7
16.8
15.3
1.8
1.6
10.5
10.4
5.6
4.9
Nilkamal
Neutral
1,613
-
2,406
2,317
2,525
11.4
11.1
96.0
105.0
16.8
15.4
2.9
2.5
0.2
0.2
1.0
0.9
Parag Milk Foods
Neutral
247
-
2,079
1,987
2,379
7.6
9.0
12.4
18.3
19.9
13.5
2.8
2.5
8.2
13.2
1.2
1.0
Stock Watch
September 12, 2017
Company Name
Reco
CMP
Target Mkt Cap
Sales ( Čcr )
OPM(%)
EPS (Č)
PER(x)
P/BV(x)
RoE(%)
EV/Sales(x)
(Č)
Price ( Č)
( Č cr )
FY18E FY19E FY18E FY19E FY18E FY19E FY18E FY19E FY18E FY19E FY18E FY19E FY18E FY19E
zOthers
Radico Khaitan
Neutral
179
-
2,379
1,811
1,992
13.2
13.2
8.1
8.8
22.1
20.3
2.2
2.4
10.1
12.0
1.6
1.5
Relaxo Footwears
Neutral
516
-
6,204
1,981
2,310
13.7
14.5
12.0
15.5
43.0
33.3
8.4
6.8
0.2
0.2
3.2
2.7
Siyaram Silk Mills
Accumulate
2,267
2,500
2,125
1,769
1,981
12.7
12.7
113.1
131.1
20.0
17.3
3.1
2.7
15.5
15.5
1.4
1.2
Styrolution ABS India* Neutral
907
-
1,596
1,800
1,980
8.0
8.1
42.0
46.2
21.6
19.6
2.4
2.2
0.1
0.1
1.0
0.9
Surya Roshni
Neutral
305
-
1,338
4,870
5,320
7.7
7.8
22.8
28.1
13.4
10.9
1.8
1.5
0.1
0.1
0.5
0.4
TVS Srichakra
Neutral
3,210
-
2,458
2,729
2,893
12.7
12.5
248.5
265.0
12.9
12.1
3.7
3.0
0.3
0.3
0.9
0.8
Visaka Industries
Neutral
649
-
1,031
1,104
1,214
12.1
12.6
31.0
37.9
20.9
17.2
2.6
2.3
0.1
0.1
1.2
1.0
VIP Industries
Accumulate
228
250
3,224
1,450
1,693
10.4
10.5
6.5
7.8
34.9
29.2
7.4
6.4
21.1
22.1
2.2
1.9
Navin Fluorine
Accumulate
667
730
3,286
945
1,154
22.4
22.6
28.7
34.8
23.2
19.2
3.8
3.3
-
-
3.0
2.3
Source: Company, Angel Research; Note: *December year end; #September year end; &October year end; Price as on September 11, 2017
Market Outlook
September 12, 2017
Research Team Tel: 022 - 39357800
DISCLAIMER
Angel Broking Private Limited (hereinafter referred to as “Angel”) is a registered Member of National Stock Exchange of India
Limited,Bombay Stock Exchange Limited and Metropolitan Stock Exchange Limited. It is also registered as a Depository Participant with
CDSL and Portfolio Manager with SEBI. It also has registration with AMFI as a Mutual Fund Distributor. Angel Broking Private Limited is a
registered entity with SEBI for Research Analyst in terms of SEBI (Research Analyst) Regulations, 2014 vide registration number
INH000000164. Angel or its associates has not been debarred/ suspended by SEBI or any other regulatory authority for accessing
/dealing in securities Market. Angel or its associates/analyst has not received any compensation / managed or
co-managed public offering of securities of the company covered by Analyst during the past twelve months.
This document is solely for the personal information of the recipient, and must not be singularly used as the basis of any investment
decision. Nothing in this document should be construed as investment or financial advice. Each recipient of this document should make
such investigations as they deem necessary to arrive at an independent evaluation of an investment in the securities of the companies
referred to in this document (including the merits and risks involved), and should consult their own advisors to determine the merits and
risks of such an investment.
Reports based on technical and derivative analysis center on studying charts of a stock's price movement, outstanding positions and
trading volume, as opposed to focusing on a company's fundamentals and, as such, may not match with a report on a company's
fundamentals. Investors are advised to refer the Fundamental and Technical Research Reports available on our website to evaluate the
contrary view, if any.
The information in this document has been printed on the basis of publicly available information, internal data and other reliable
sources believed to be true, but we do not represent that it is accurate or complete and it should not be relied on as such, as this
document is for general guidance only. Angel Broking Pvt. Limited or any of its affiliates/ group companies shall not be in any way
responsible for any loss or damage that may arise to any person from any inadvertent error in the information contained in this report.
Angel Broking Pvt. Limited has not independently verified all the information contained within this document. Accordingly, we cannot
testify, nor make any representation or warranty, express or implied, to the accuracy, contents or data contained within this document.
While Angel Broking Pvt. Limited endeavors to update on a reasonable basis the information discussed in this material, there may be
regulatory, compliance, or other reasons that prevent us from doing so.
This document is being supplied to you solely for your information, and its contents, information or data may not be reproduced,
redistributed or passed on, directly or indirectly.
Neither Angel Broking Pvt. Limited, nor its directors, employees or affiliates shall be liable for any loss or damage that may arise from
or in connection with the use of this information.